
 Topics covered
- HR
- KPI
- Client
- Project
Excel PivotTable Library for download
Synthesise, analyse, explore and present data using pivot table models.
What is an Excel pivot table?
Definition
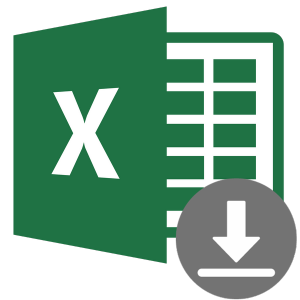
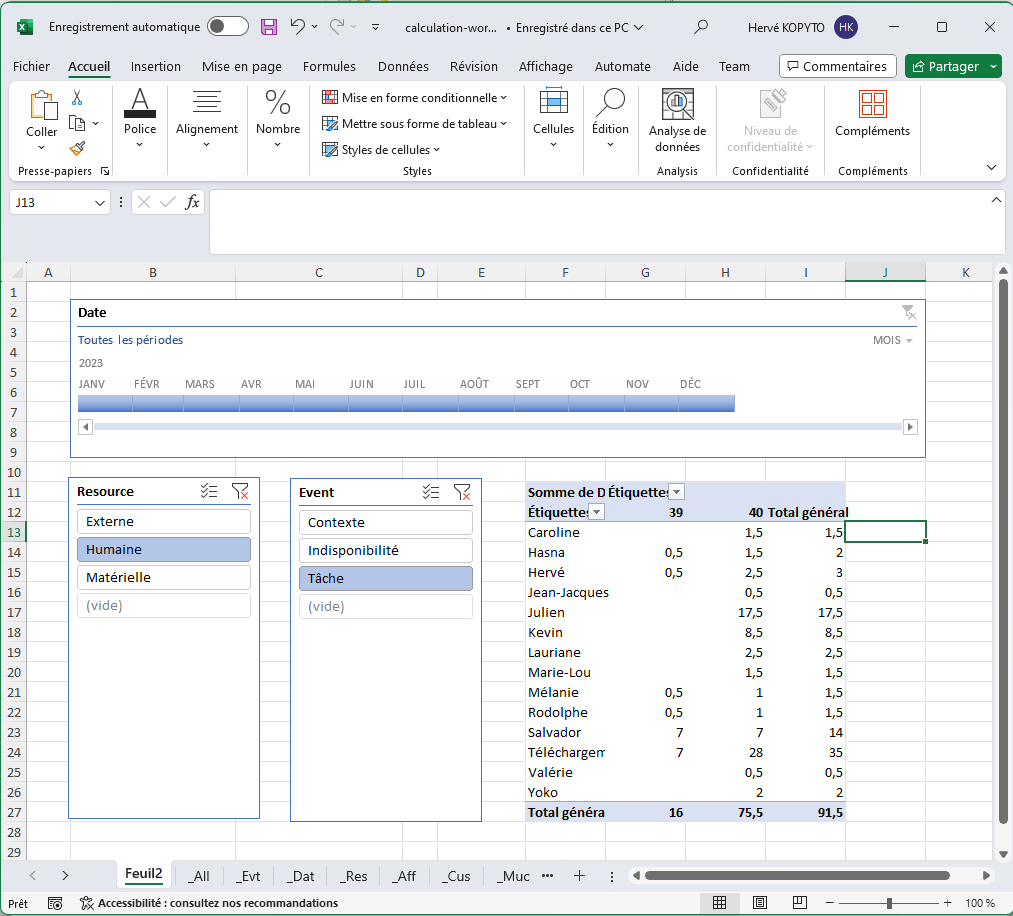
An Excel pivot table is a powerful tool for summarising, analysing, exploring and presenting data in an easily understandable way. It is mainly used to restructure and group selected data into a condensed format, in order to extract meaningful statistics. Pivot tables can perform automatic calculations on your data using the values you specify. The data fields determine the dimensions of your table and can be dynamically adjusted to change the presentation of your data. The information is organised in a concise way on an Excel sheet, making it easier to analyse and interpret.
Download PivotTable Templates
What are the advantages of a pivot table in Excel?
Excel pivot tables offer a host of advantages for managing and analysing data. Here are some of the most notable:
- Ease of use : With Excel, creating pivot tables is a simple and straightforward process, making this tool accessible to all users, whether novices or experts.
- Rapid data analysis : These tables enable large quantities of data to be processed and analysed quickly.
- Flexibility : Pivot tables are extremely flexible. You can add, delete or modify the fields in your table in just a few clicks, so you can quickly adapt the analysis to your needs.
- Automatic calculation : These tables perform automatic calculations on your data (sum, average, percentage, etc.), saving precious time.
- Clear presentation of data : With pivot tables, you can transform complex, messy data into clear, concise information that's easy to understand and present.
FAQ
- Excel : Open the file in Excel or double-click on the pivot table template
- Shaping : Perform table formatting and conditional formatting in the pivot table worksheet
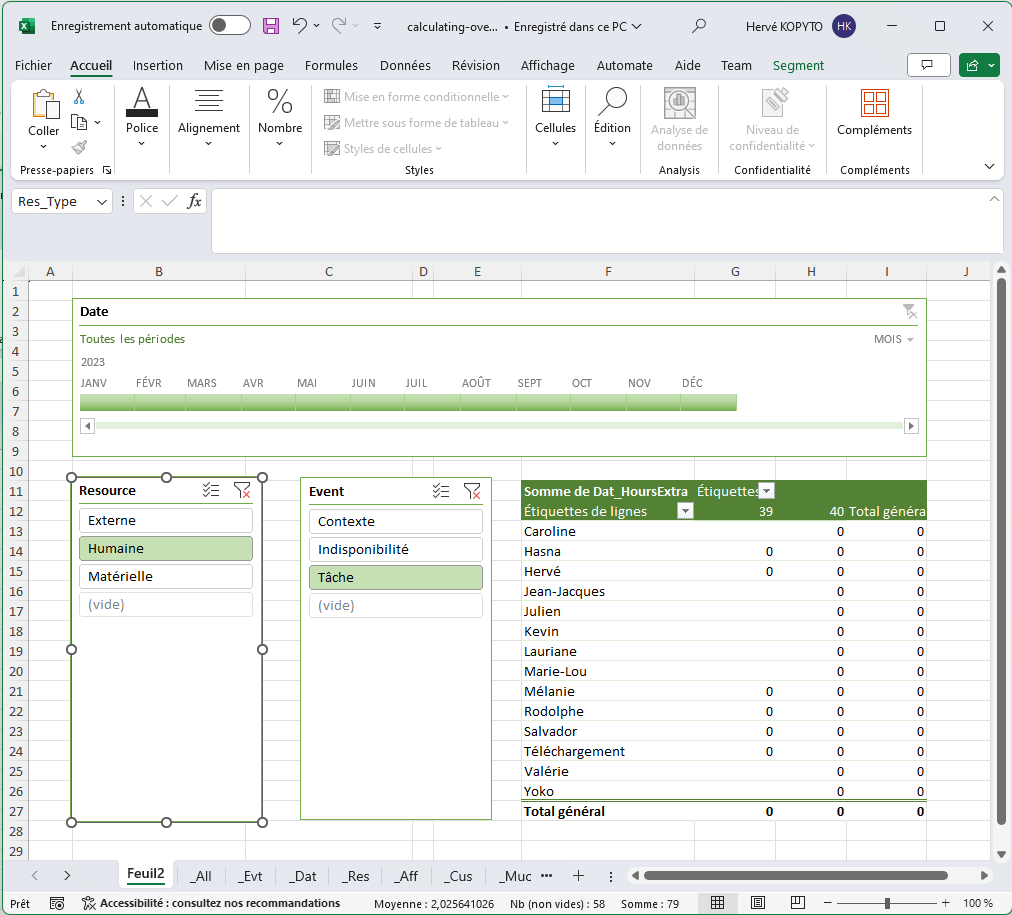
- Filters and Segments : Filter your data according to your criteria
- Register : Save your dynamic pivot table model in Excel
It only takes 30 seconds to create your Excel pivot table with PlanningPME Web Access :
- Report : Click on the cogwheel at the top right, then select the "Report" menu.
- Pivot table model : Select the template you wish to use from the list or Add the template you have downloaded.
- Dates : Enter the start and end dates.
- Confirm : Press the "Validate" button to create your Excel pivot table.
- Open the Excel pivot table : In Downloads, open the pivot table file, then in Excel, press the "Activate modification" button, press the "Refresh all" button in the "Data" menu to refresh the data and select your segments.