

Contents
Why using Power BI?
Create visual reports and dashboards adapted to your business activity that enable you to make decisions and have good insights to conduct your business with fluidity.
You can synchronise all your data with Power BI, the powerful business intelligence reporting service from Microsoft. It combines the power of analytics with a user-friendly interface and incredible data visualisation.
Advantages
Thanks to the many features of PowerBI, you can among others:
- Transform planning data into nice visuals
- Share visual information with your colleagues or customers via a simple web link accessible at any time from anywhere
- Take decision rapidly with powerful KPI updated in real time
- Collaborate and share customised dashboards and interactive reports
- Get customised analytical reports on all types of platforms
How to connect scheduling data
Via PlanningPME API connector
Power BI connects to PlanningPME via a PlanningPME API connector . All information about resources, customers, events, and projects can be analysed and used to create relevant reports.
You can contact us to discuss your requirements.
PowerBI Mobile
View Power BI reports and dashboards in real time on Windows, iOS, and Android mobile devices.
Integration on a website
Share reports directly on your website with embedded integration options.
Play with this Live Report example.
Examples of dashboards and insights
Here are some examples of reports below: a live report, reports by type of position in the company. This list is not exhaustive. You can contact us to discuss your requirements.
Live Report Example
Here is an example of a "Live" report extracted from template created with the application PlanningPME Web Access. You can filter, switch from one report to another directly by playing on the sample report below.
Description of this report
- Get working time by resource, by client, project using dedicated graphical formats and dedicated calculations from the database
- Graphical analysis
- Easy indicators and dashboards via smartphone for service managers
- Easy reports for Administration which is not using PlanningPME
For Service Planners
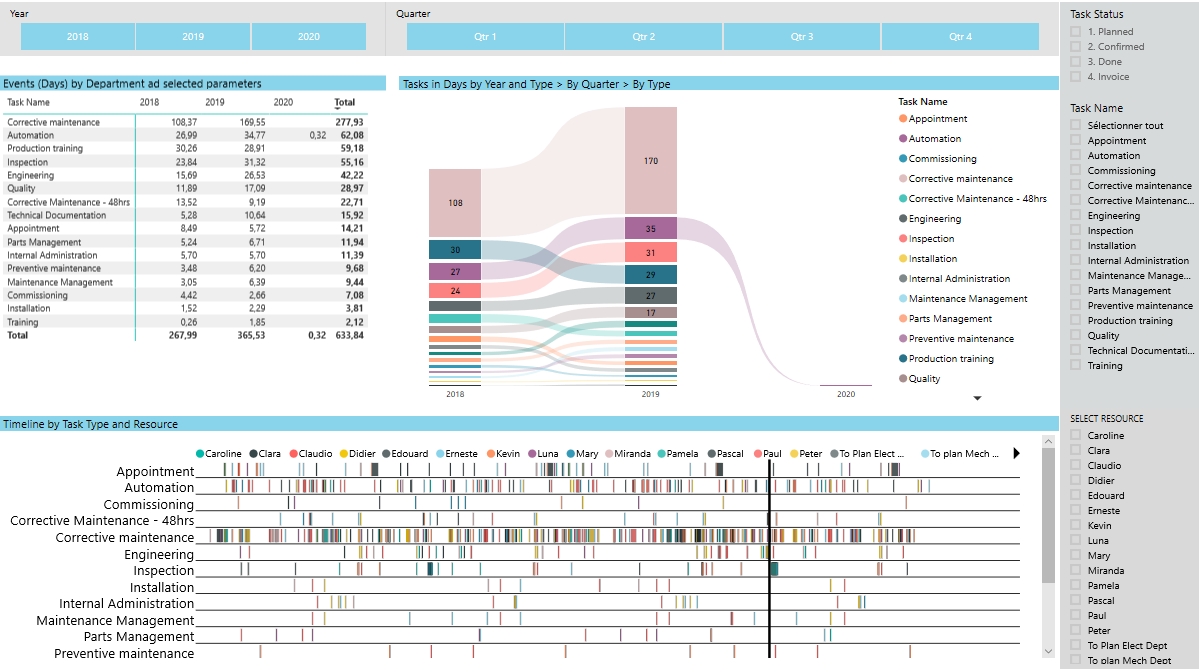
Interest: Know in real time the number of people working as well as ongoing activities. For example, check rapidly on a graph the number and types of tasks performed over a month.
- Workloads by Resource by period (Y/Q/M)
- All tasks TBL and Graph
- Take decision rapidly with powerful KPI updated in real time
For Administration
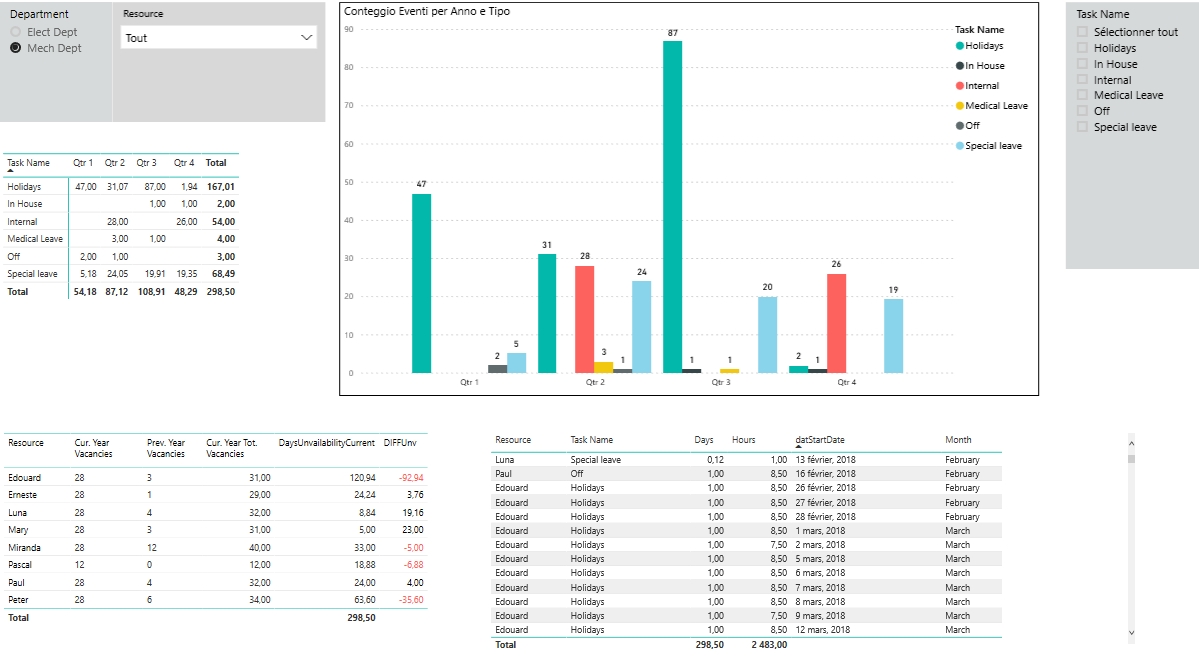
Interest: Check at a glance people on leave over a day or a month
- Unavailabilities with Graph by type by period
- Matrix by Resource by Year by Month by Unavailability type SUM Days
- Calculations on available vacancy days
- Select by Department and by resource or all
For Managers
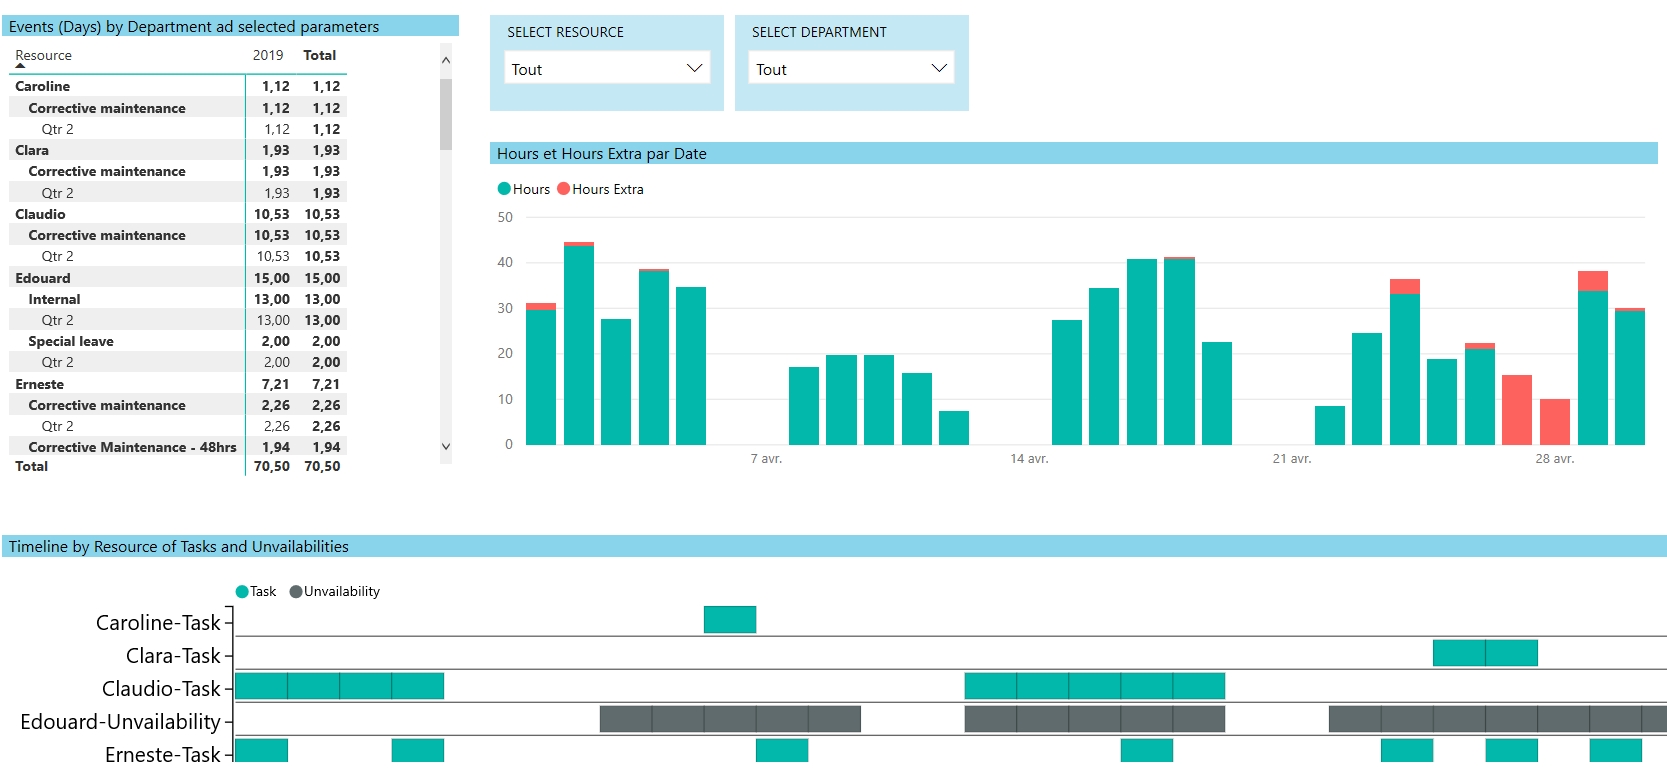
Interest: Analyse performances and make fast relevant decisions
- Graph with Sum of tasks by type by Customer
- SUM of Time for Task type
- Workload by department
Contact
Need advice, a quote, or more information about possible integrations with the tools you already use in your business?
We are here to answer all your questions.
Need advice, a quote, or more information about possible integrations with the tools you already use in your business?
We are here to answer all your questions.