Indicators
Tutorial PlanningPME
Discover the latest feature from PlanningPME: the indicators transform your planning software into a dashboard program.
1 - Presenting the indicators
The indicators show real-time calculated data based on the information contained within the schedule. They are displayed as lines, columns over a daily, weeekly or monthly view.
2 - Video
3 - Examples of indicators
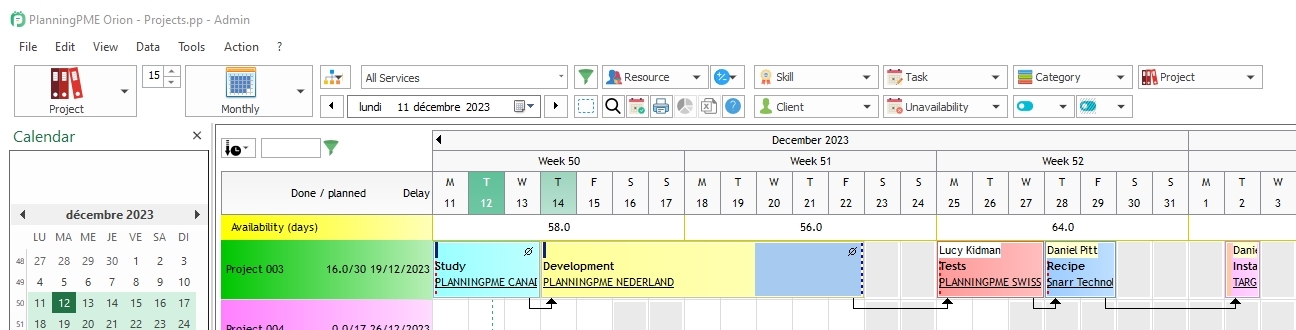
-Duration of the events : The total number of hours for the events on the planning. You can have now consequent information concerning the workload of your employees or machines (1)
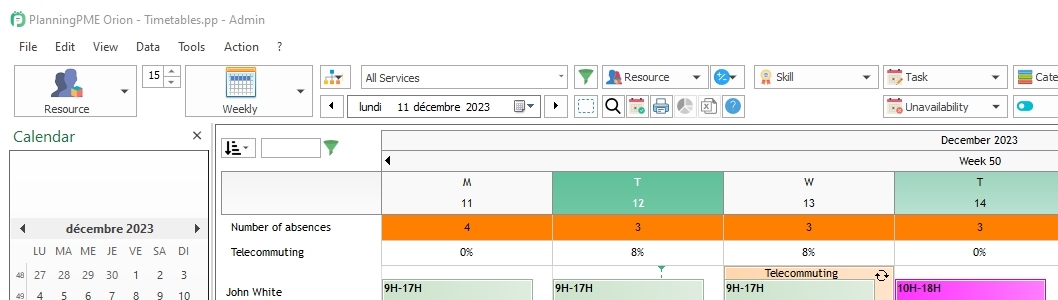
-Number of events totalised in the planning. You can for instance see the number of completed tasks and of tasks yet to-plan (2)
-Theoretic capacity: the work capacity of your resources based on their time profiles.
-Real capacity : The theoretic capacity minus the unavailabilities
-Duration of free-time periods: see the percentage of availability of your resources based on their work slots. (3) Doing so, you can optimise the working time of your resources
To refine the displayed information, you can input criteria to evaluate only some data. Criteria analyse resources, department, skills, bookings, unavailabilities, clients and projects. You can, for instance, calculate how many hours were spent in installation for the IT department
Set a target figure within your indicator, defining the goal to be reached depending on your data (4) or another indicator!
Choose the display unit of your indicators among: hour, day, percentage, difference or value
You can also choose to have the indicators displayed on a vertical or horizontal frame, atop or at the bottom of the screen. You can also define the height, colour, type of view (resource, client, project), and the department where they need to be shown.
The indicators can be public or private, and are perfectly implemented in the user rights of PlanningPME
The threshold (5) values change the colours of the indicators on the dashboard. You can choose your own colours, and they will be displayed to warn you of any changes. For instance, you can have the indicator turn red if it goes over 95%